
Hello! We based week two around the CO2 sensor that we received last Thursday. Our week began with testing the CO2 sensor. Sean, Charlie, and I tested the sensor’s accuracy on top of the University of Utah’s Union roof. We placed the sensor varying distances away from the Panda Express vent in order to determine the accuracy. By checking the average amount of CO2, in parts per million, at varying distances from the vent, we determined that the sensor was accurate, even after only a couple hours of calibration.
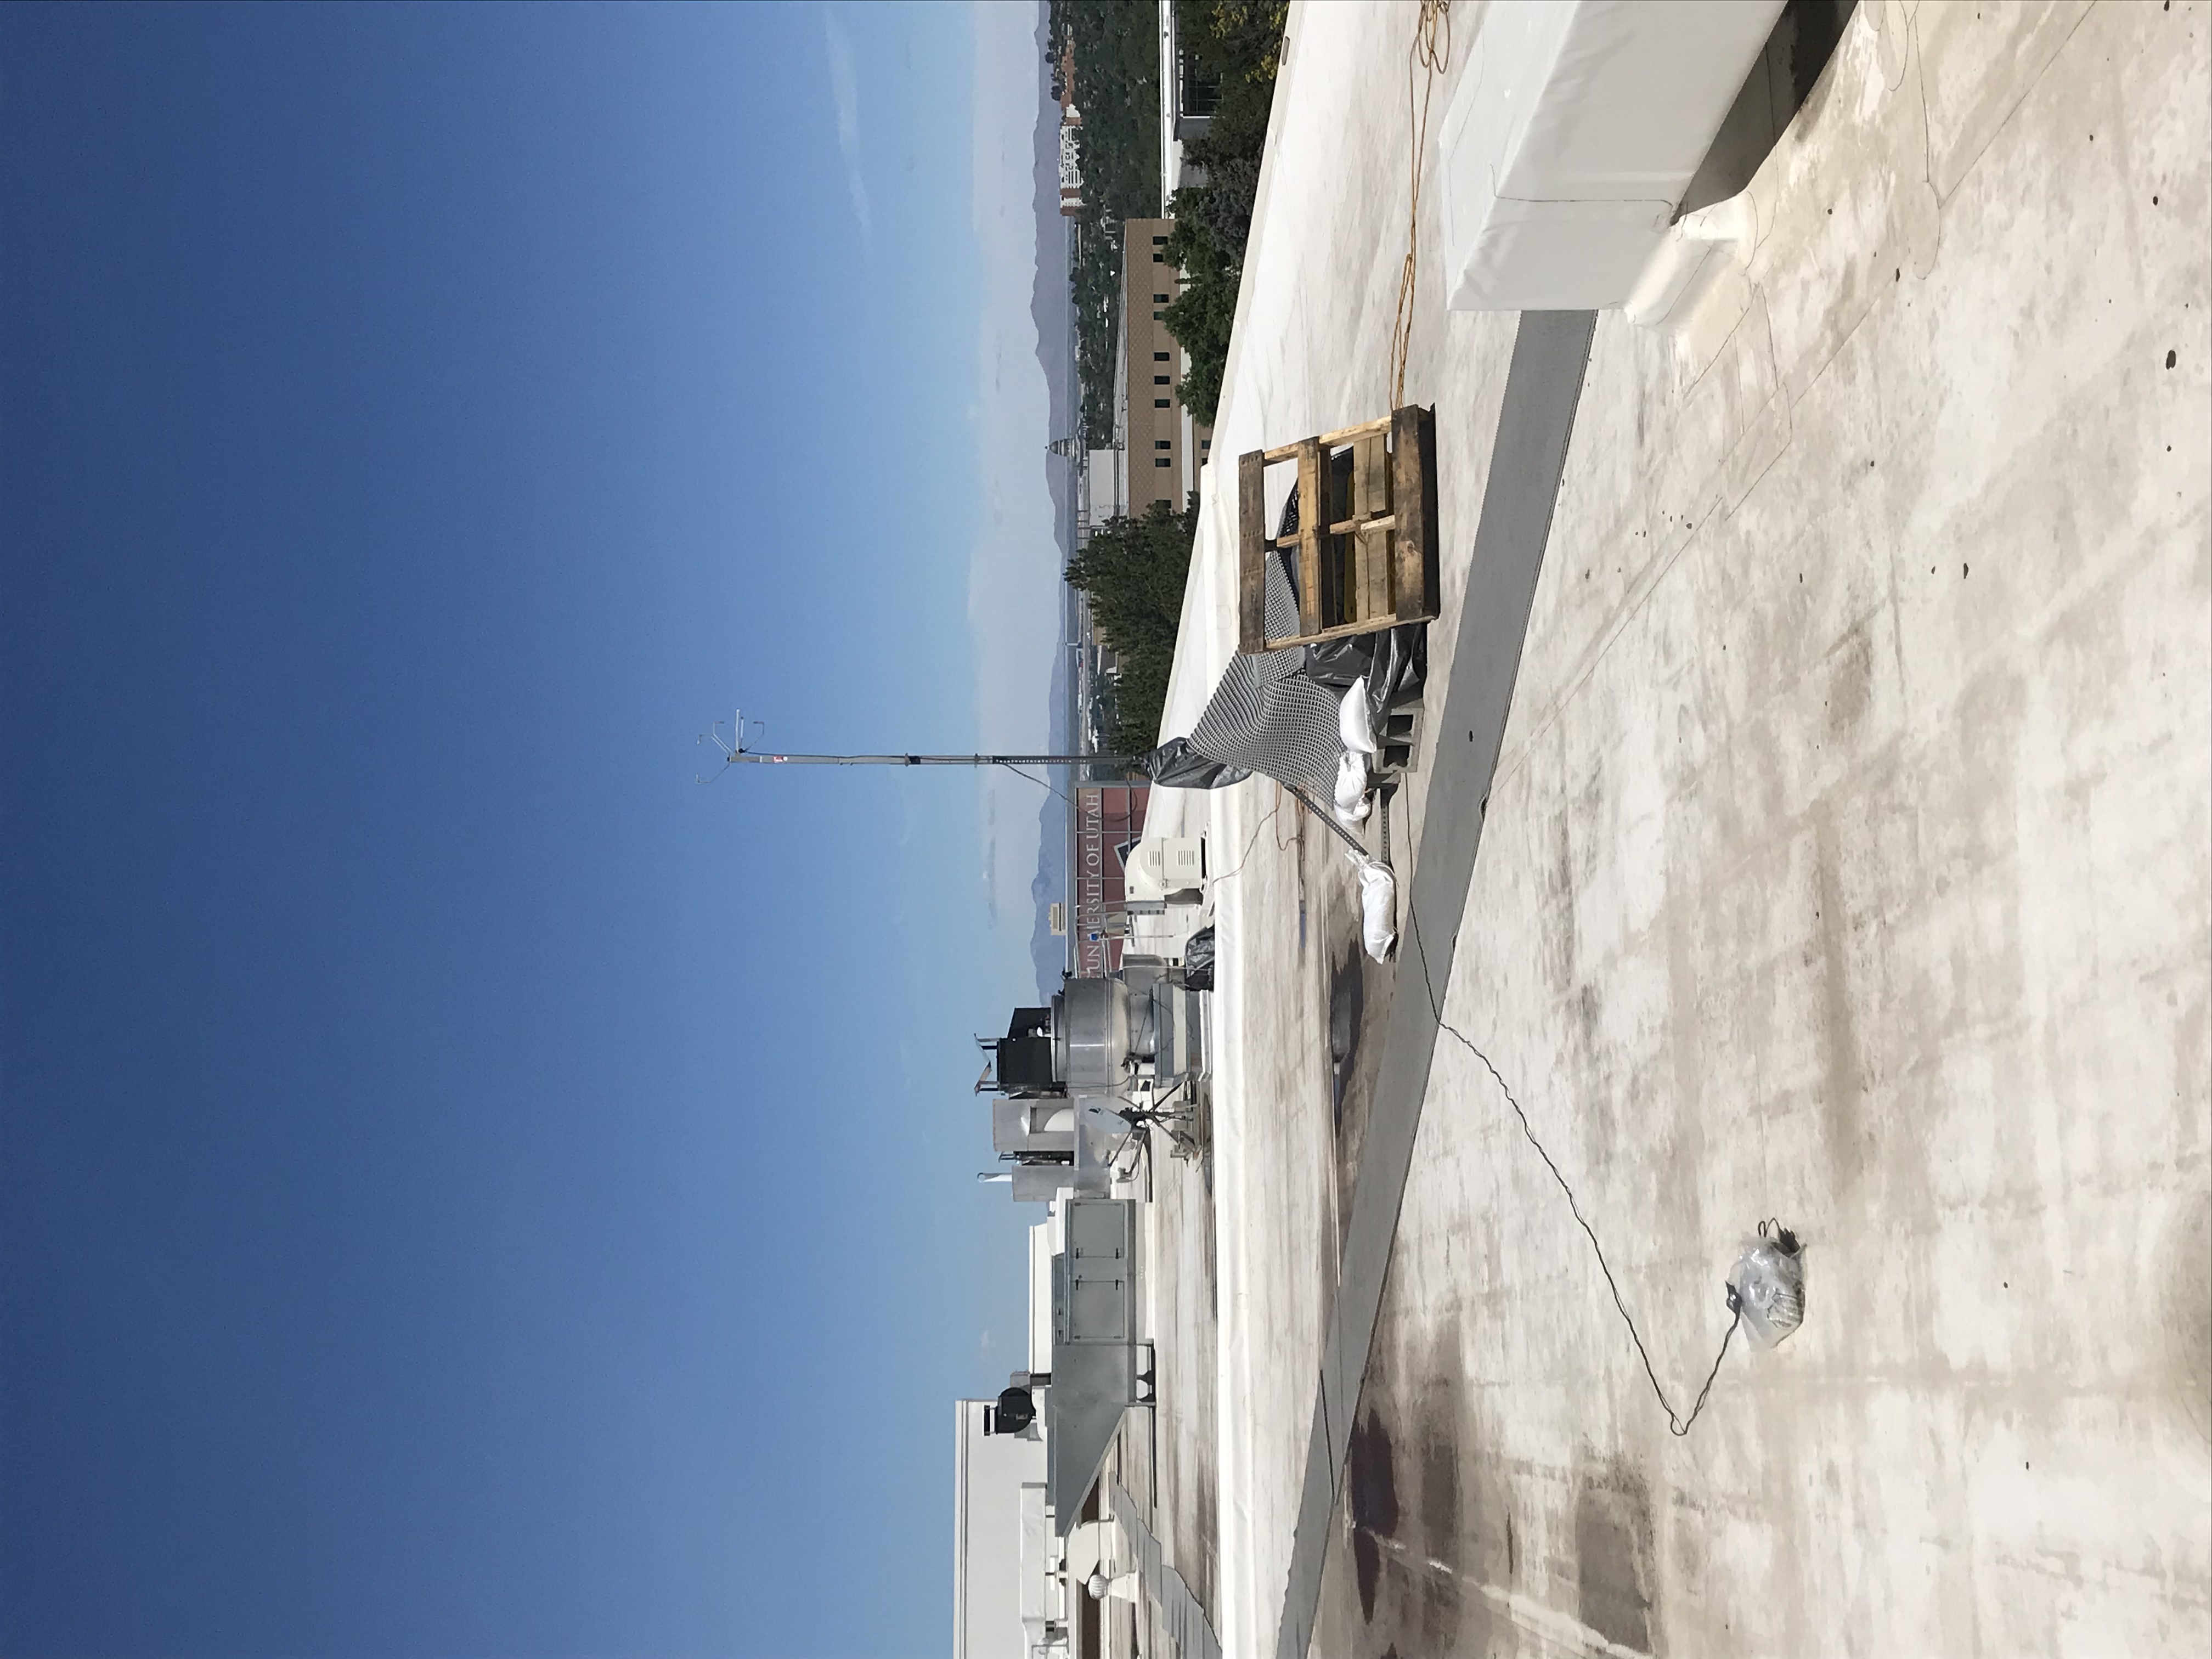
Union Roof with the Panda Express vent being monitored.
Next, we were introduced to 3D printing. We plan to use a 3D printed capsule to hold the Arduino and CO2 sensors. After planning the design of these capsules, we were allowed to have some fun with the 3D printers at the library. Charlie had designed a plaque with our team name written on it using the Fusion 360 software. He printed the plaque out and we now have a team name.
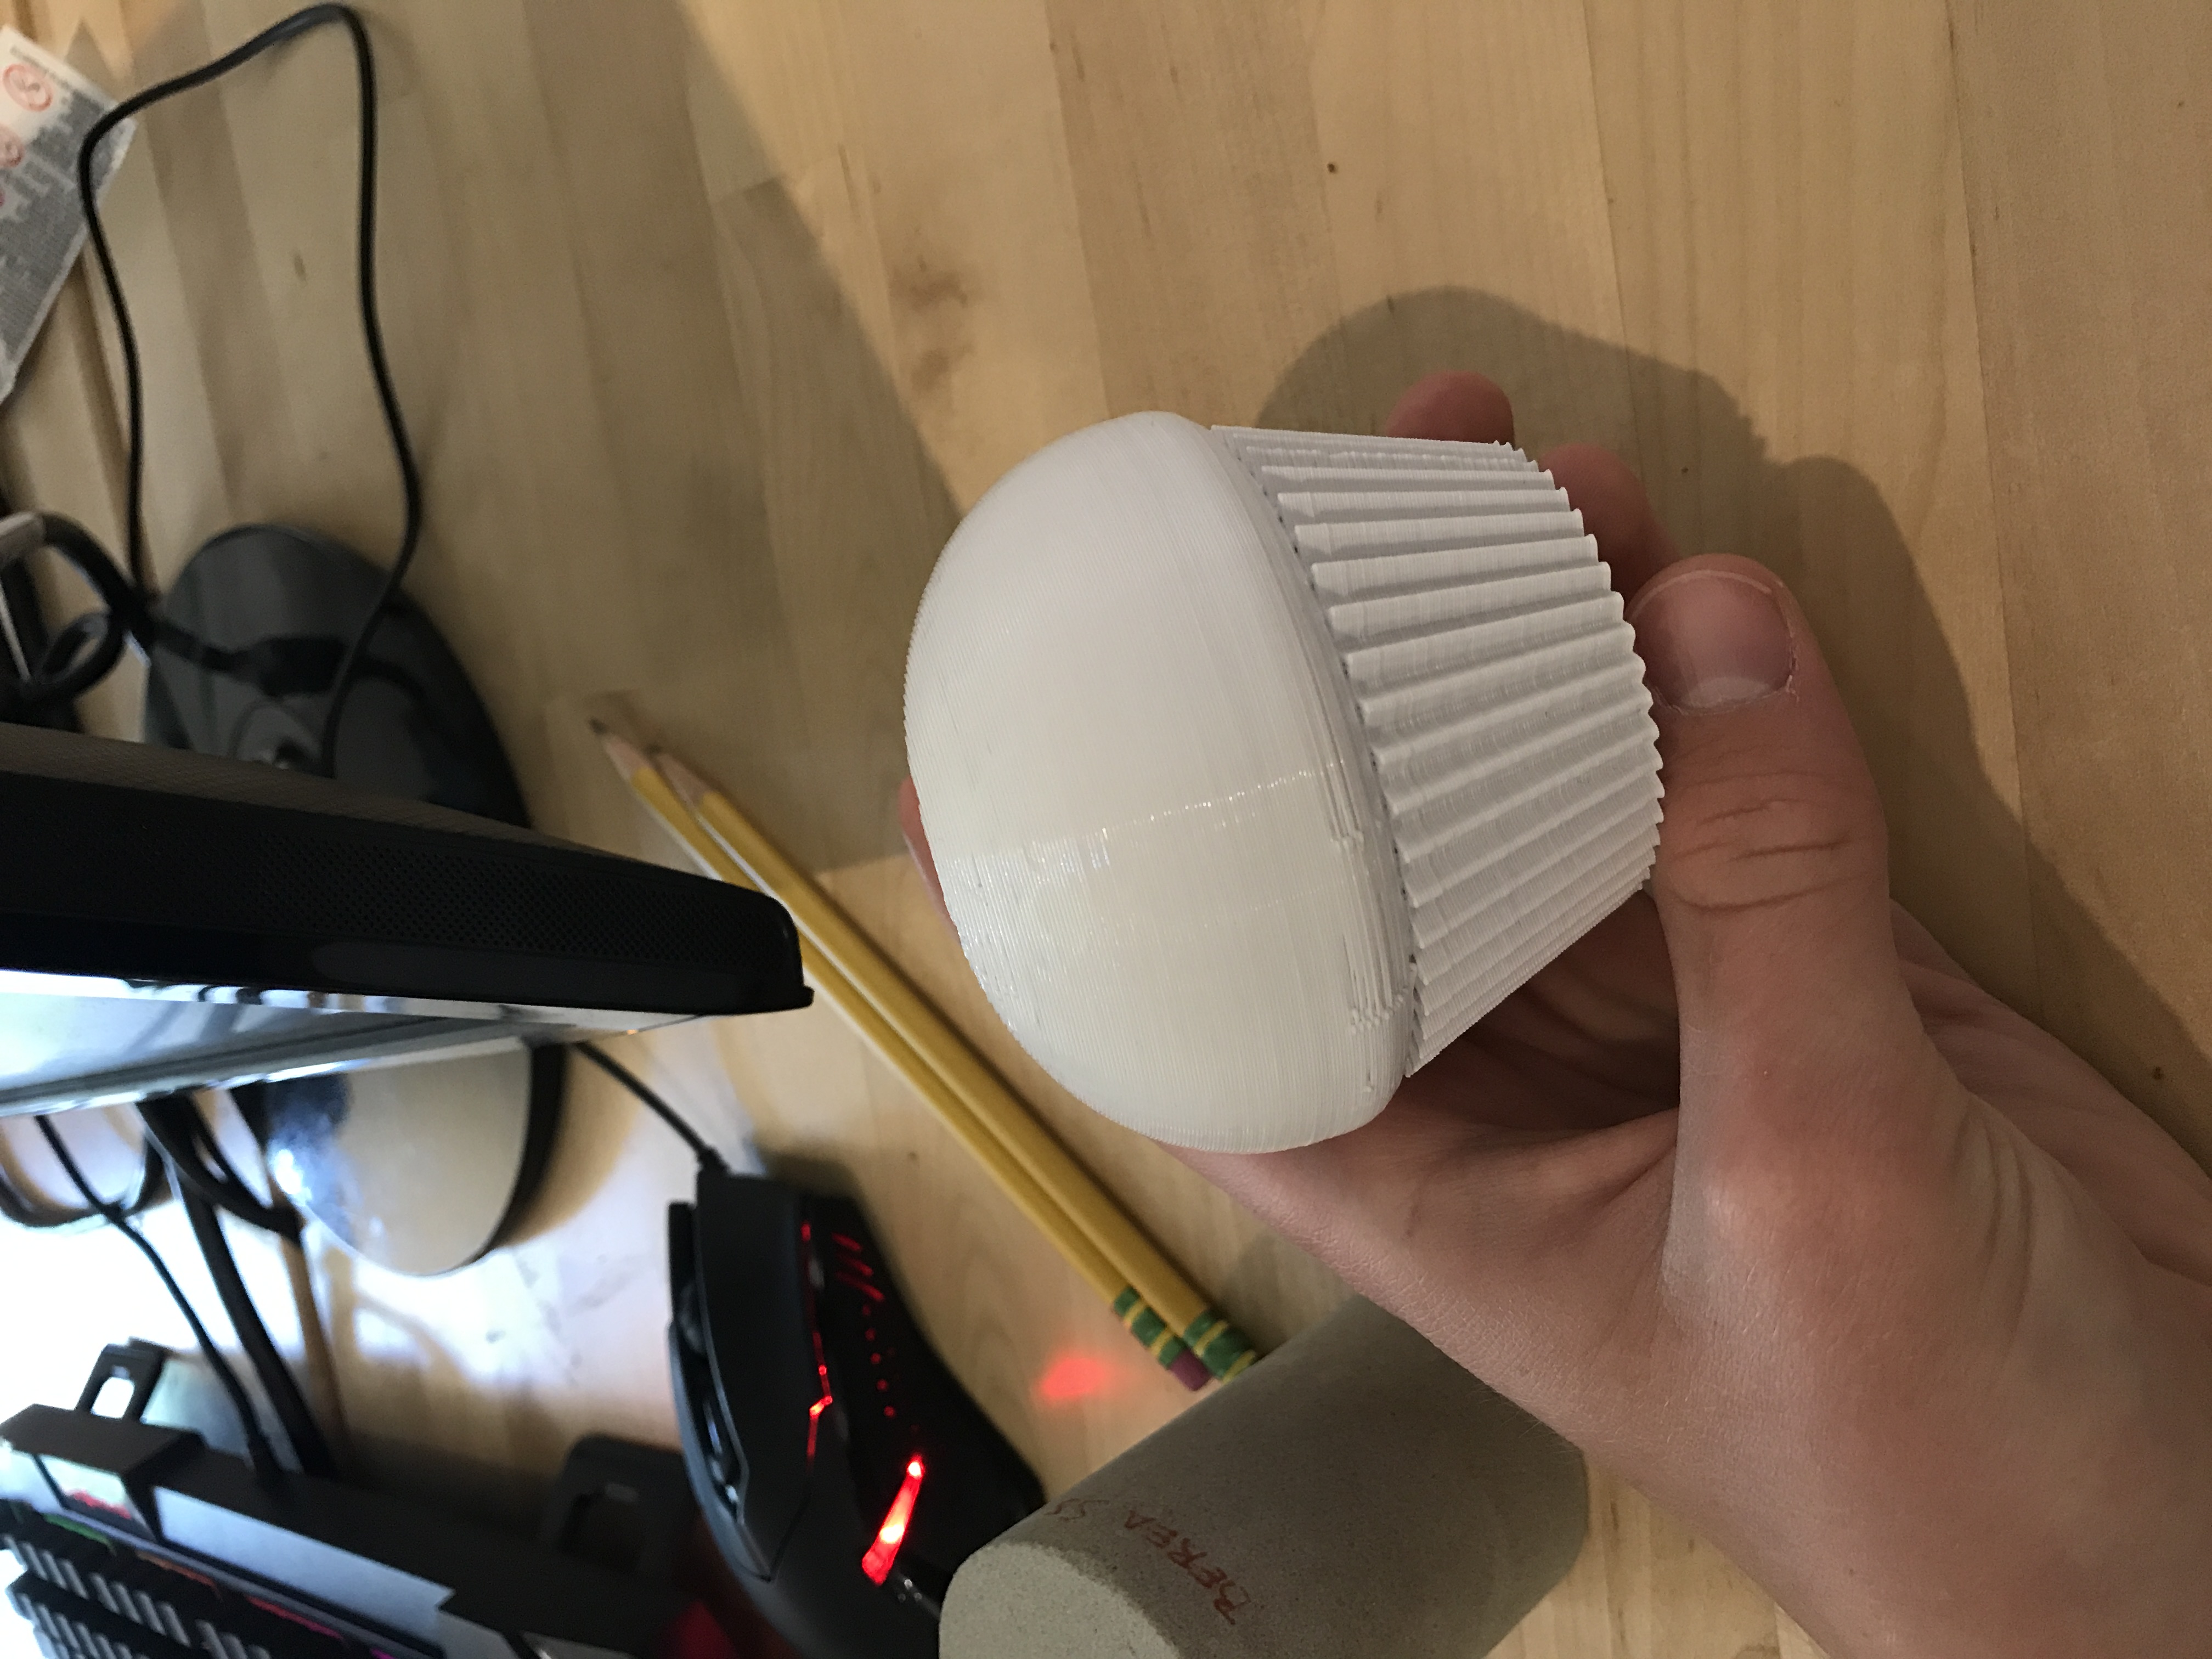
We used the Library’s 3D printers to print out designs. I printed a muffin.
My next task was to gather and store data from the CO2 sensor. So, using some basic code and the PySerial library, we collected data from the CO2 sensor during calibration and stored it into a file. However, the sensor had an error which effectively ended our ability to collect data. We ate lunch with Charlie and Adriann before Charlie left for Ireland on a two week vacation.
Wednesday, we had a team meeting, where Sean and I gave a short presentation on what we had done last week. After the meeting, I thought about ways to cool a CPU on top of the Union. The CPU was reaching very high temperatures in the Utah summer heat. So, I did some basic internet research and drew some diagrams of the tent shading the CPU.
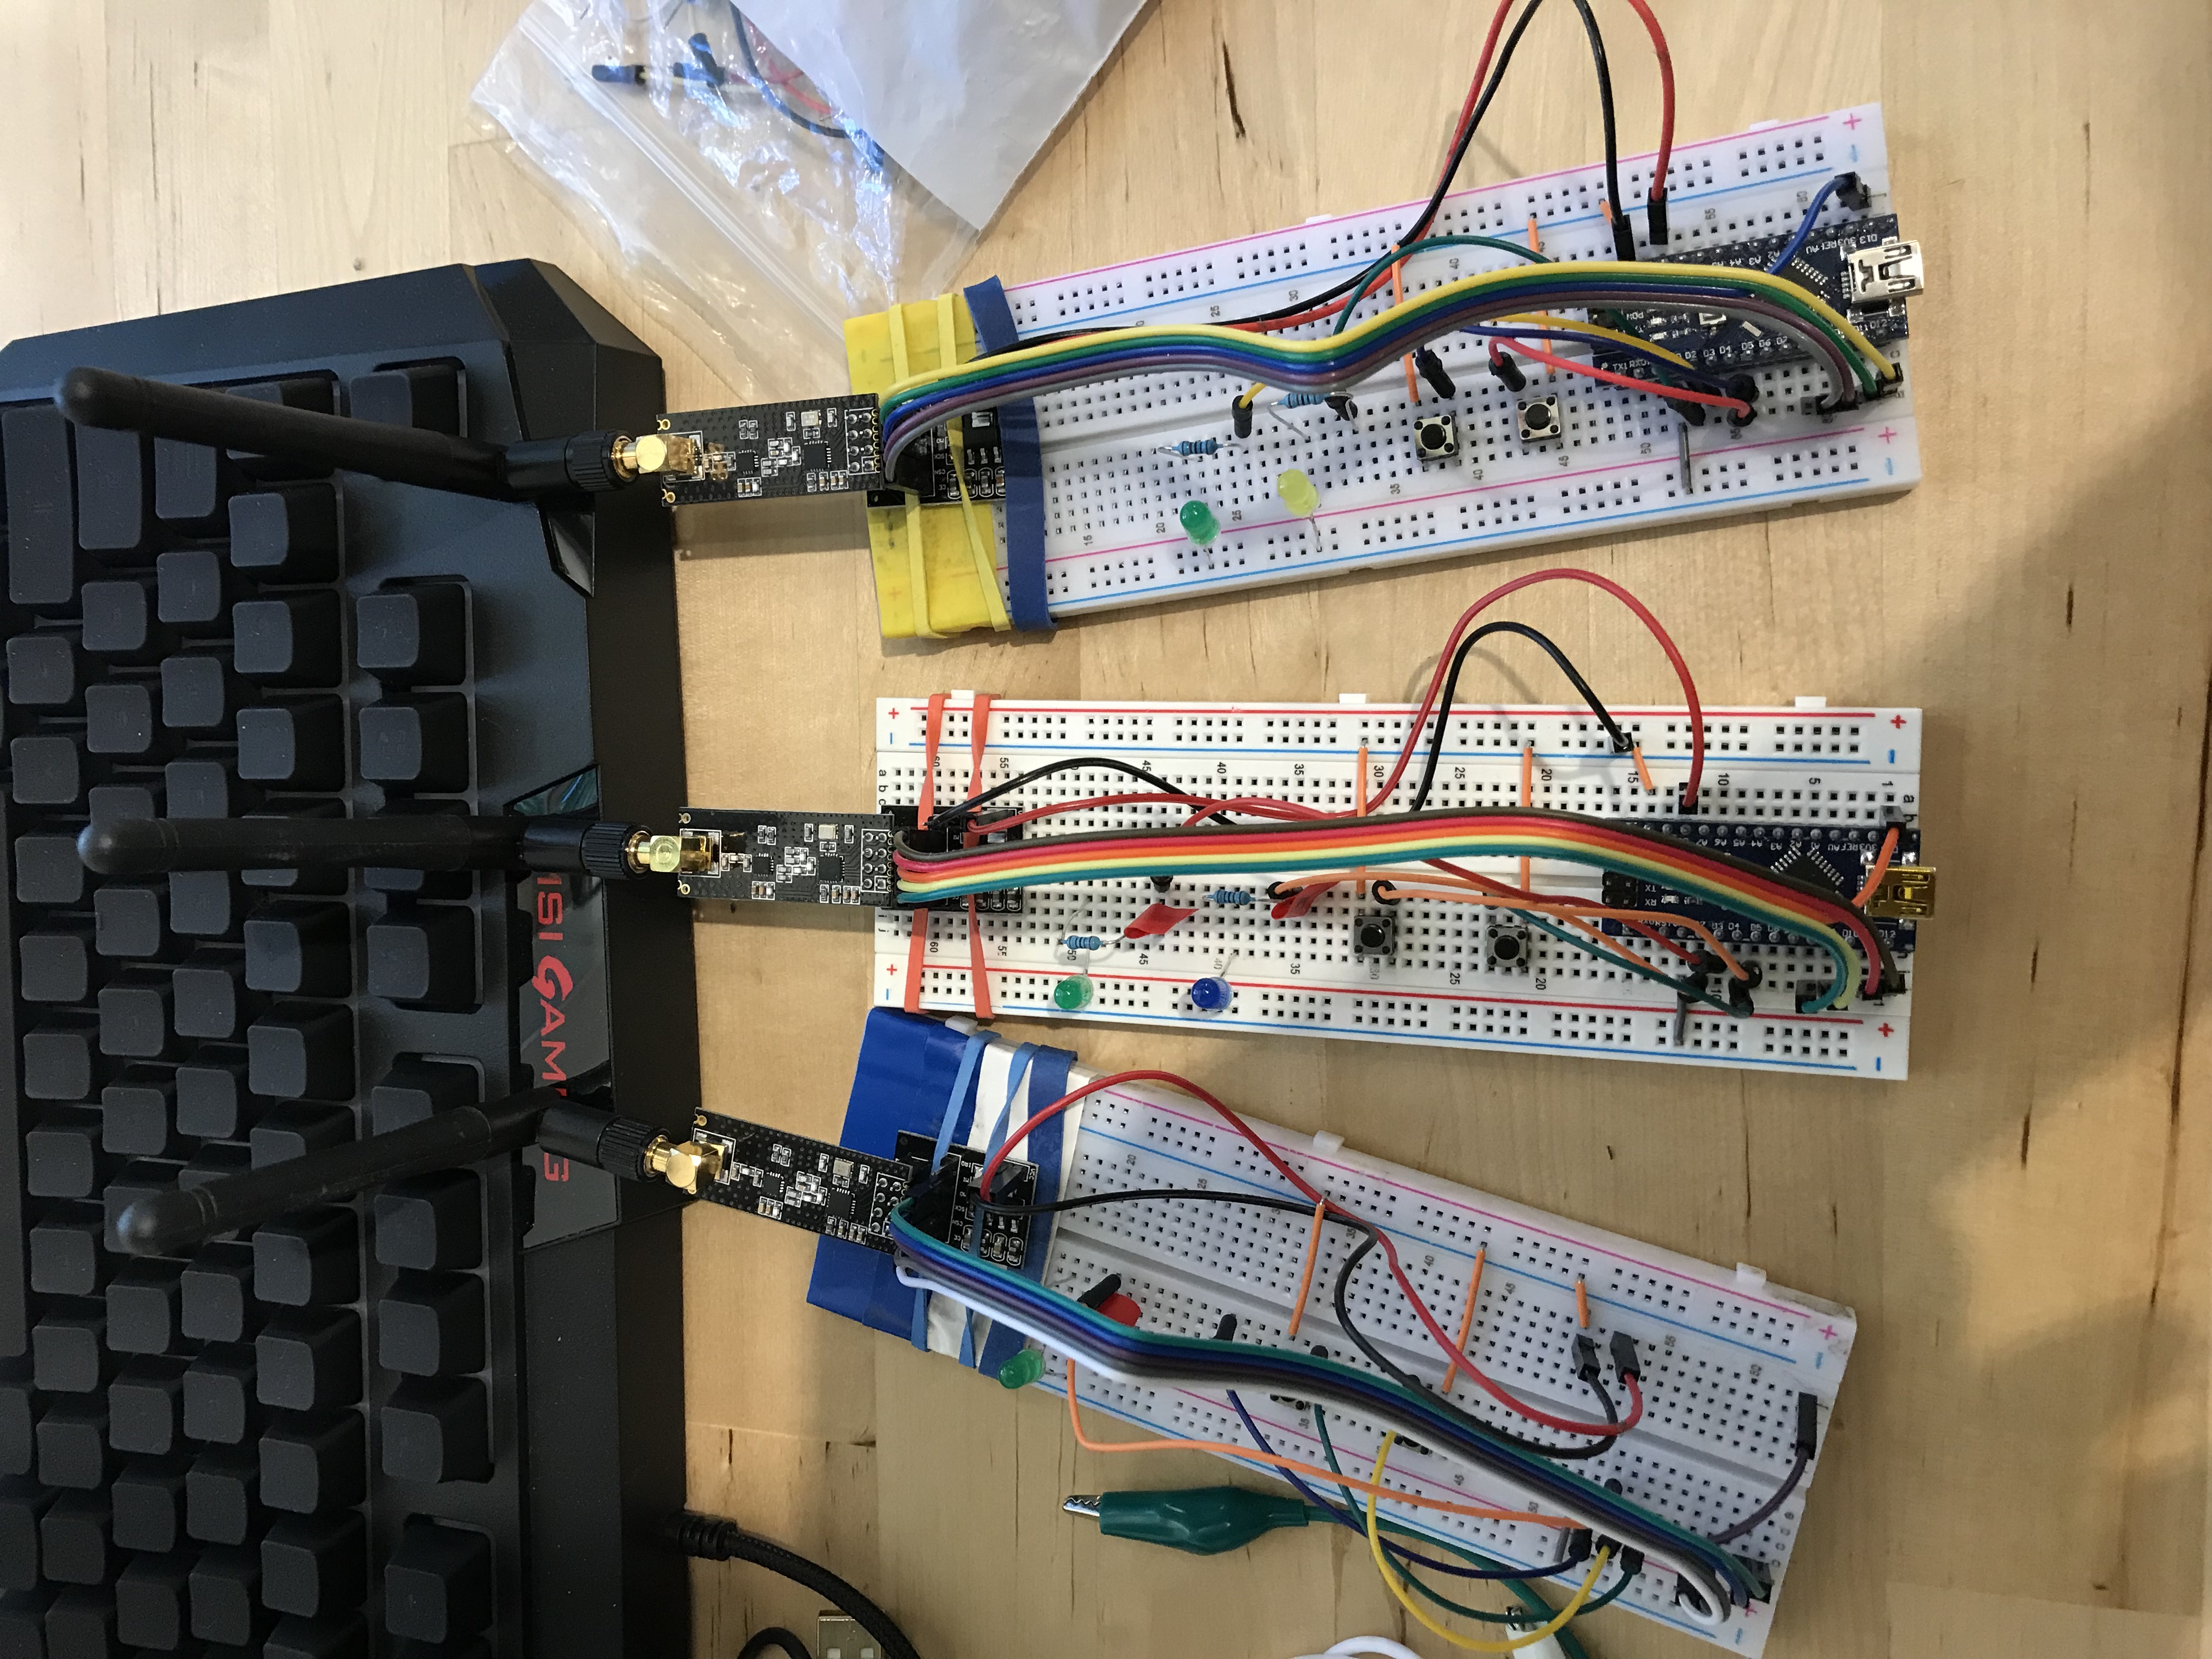
Modules that are being tested on how to transmit and receive data.
After I couldn’t collect more data from the sensor, I started playing around with plotting live data from a sensor connected to the computer. Using the MatPlotLib library, I was able to collect data from a temperature sensor and display the data live on screen. After refining and testing, hopefully we can use this program to plot live data of the CO2 grid.
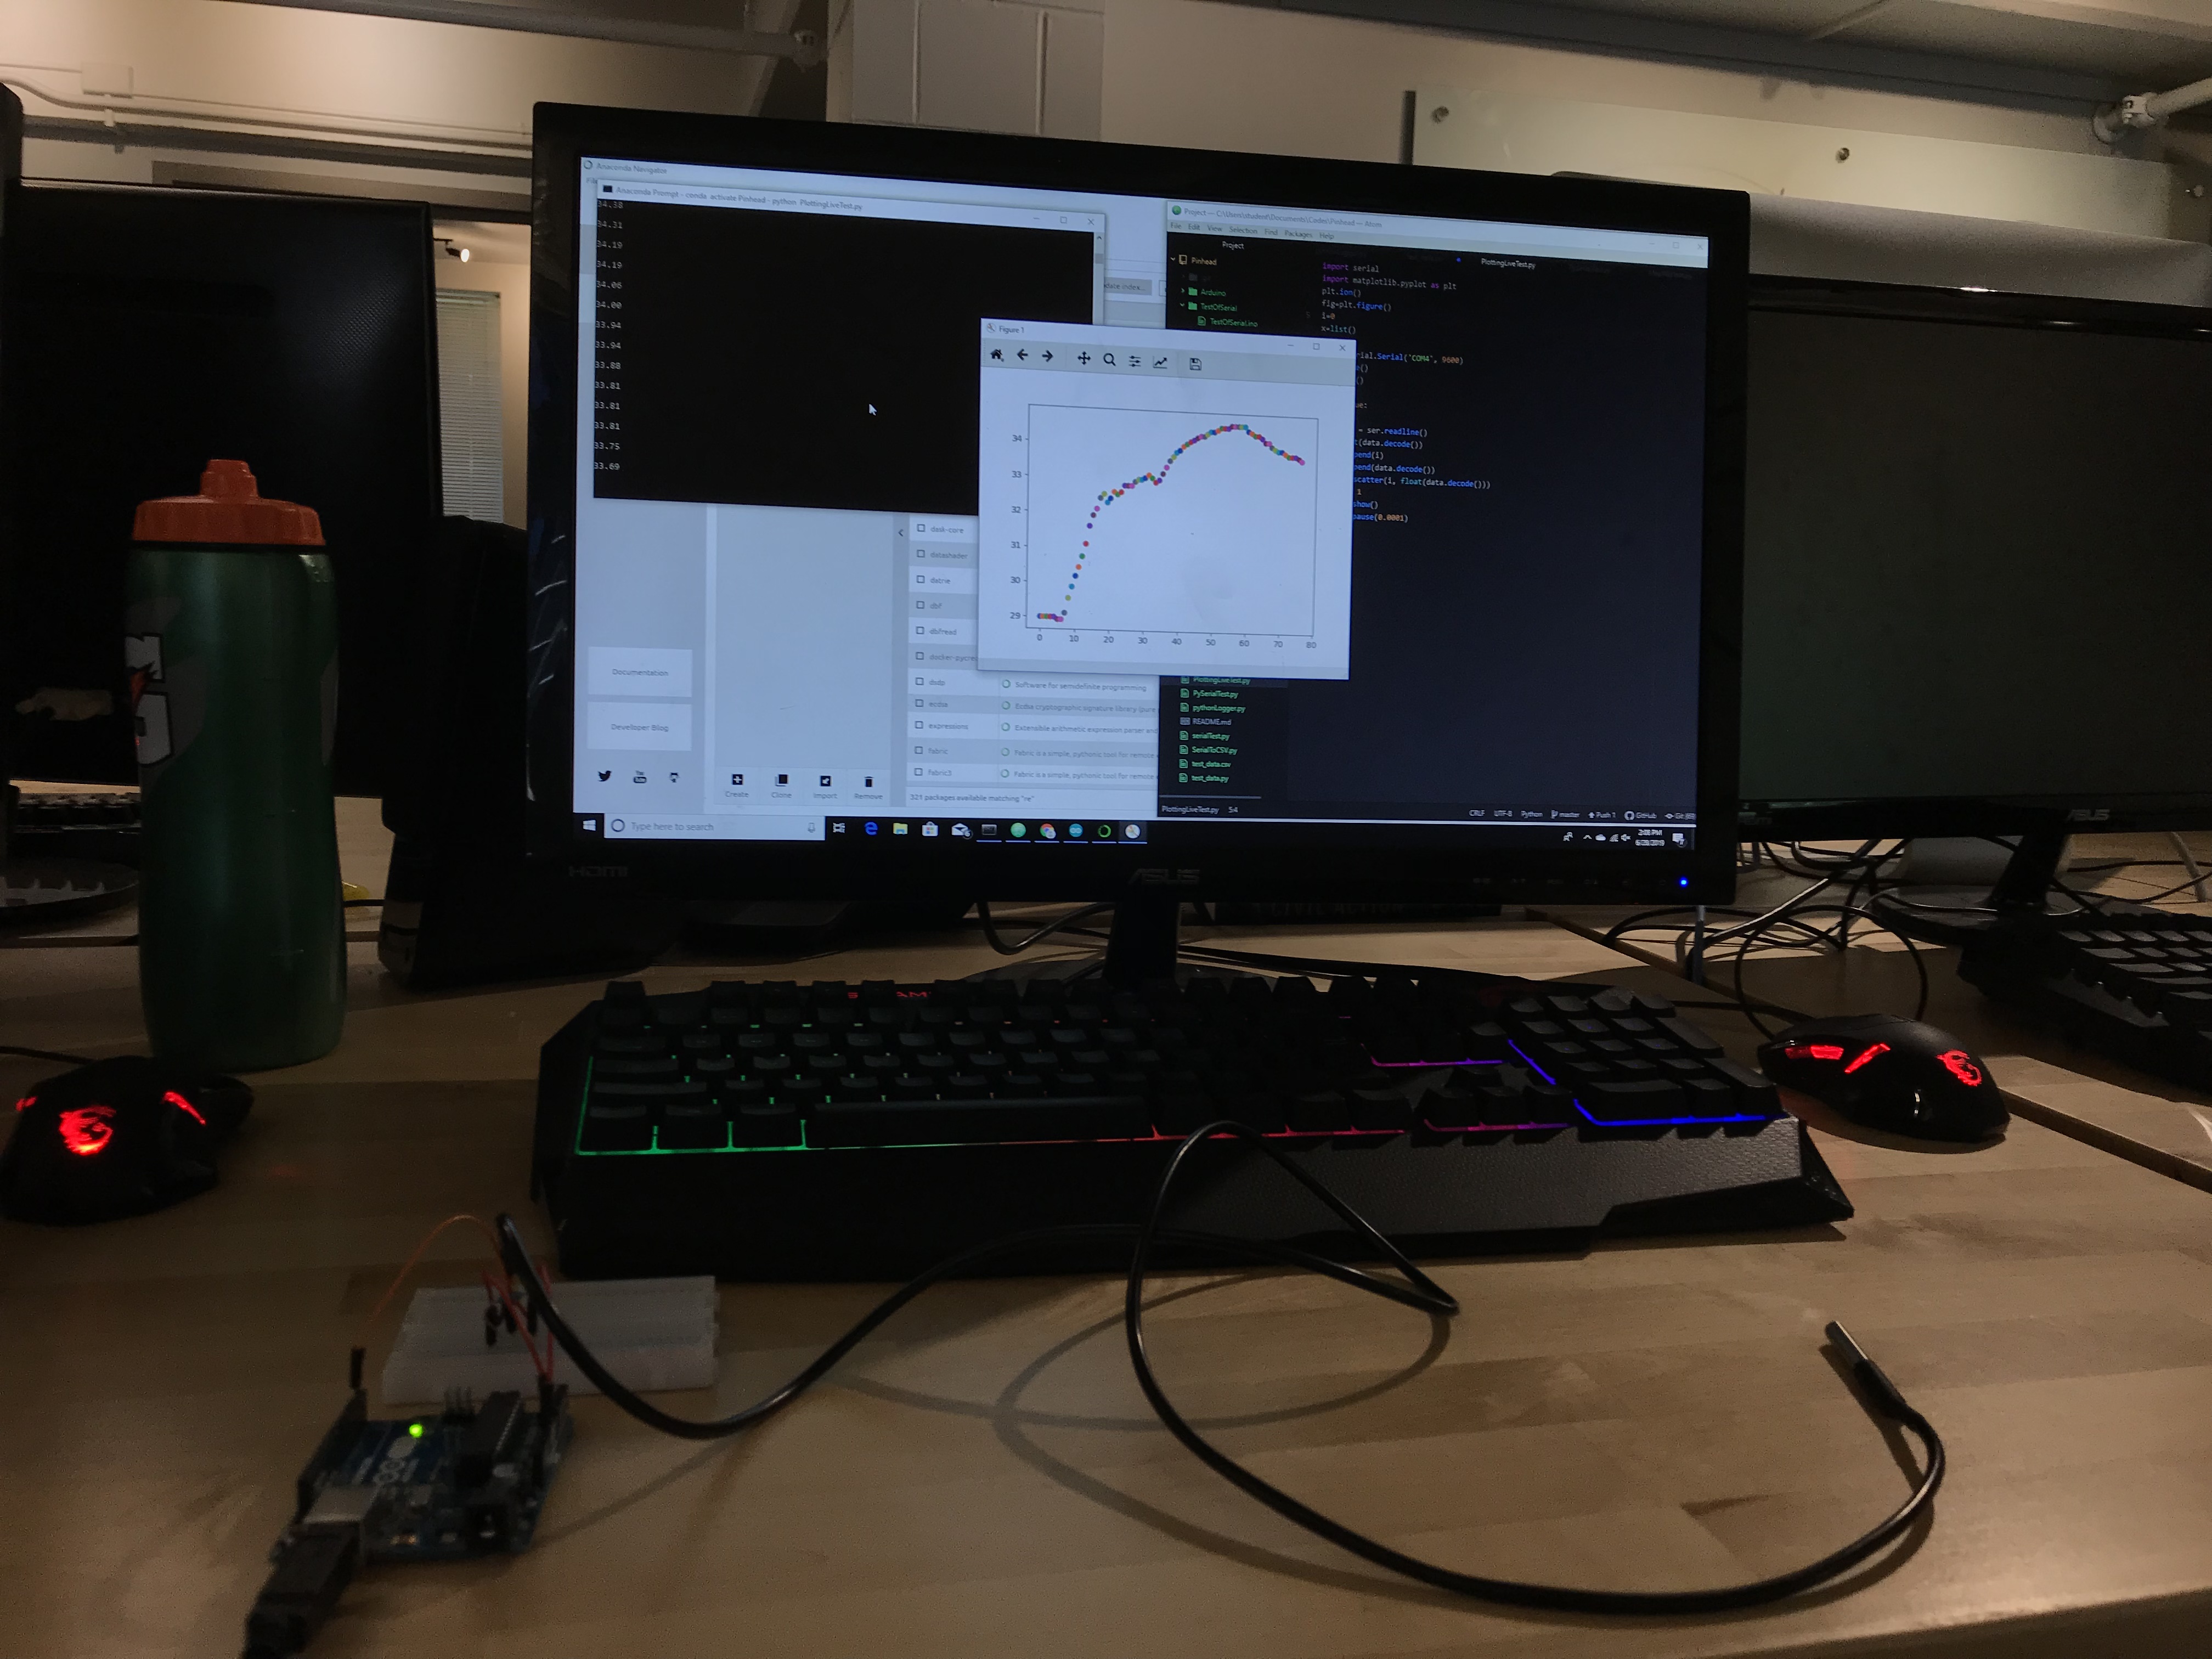
Program to plot live data from a temperature sensor.
On Friday, I worked on improving my code with Sean. We spent a lot of time debugging and trying new things. Eventually, we decided that it would be best to have an Arduino print data to the serial monitor in the format we want, so we don’t have to use Python to clean the data.
It was a great week with lots of progress. In the future weeks, we plan to focus more on 3D modeling in order to create Hele-Shaw-Cells. I am excited for this because it will be something different from coding. See ya next week!
There are no comments published yet.