
My third week in the lab consisted of working with three new analysis. The first is called System Energy Analysis. System Energy Analysis focuses on analyzing the correlation of system energy with measured IC50 values. What this basically does is it takes the average energy for each ligand, there’s six in total, and compares it with the measured IC50 values of each. It helps analyze the systems and see if there’s any correlation between the two values. Also, while working with this analysis, I learned how to construct figures from Matplotlib, a plotting library for the Python programming language.
The other analysis is called Principal Component Analysis(PCA). This analysis helps you analyze and visualize molecular dynamics(MD) simulation trajectories. In other words, PCA takes multi-dimensional data and transforms it into a 2-D or 3-D plot that is easier to understand. Multi-dimensional data can have dozens of dimensions, which is why PCA makes it easier to analyze. There’s a total of six Hsp90 systems and each system has three trajectories, so I had to do a total of 18 PCA analyses. Once I extracted the principal components for each system, I had to analyze each one to see if there was any correlations.
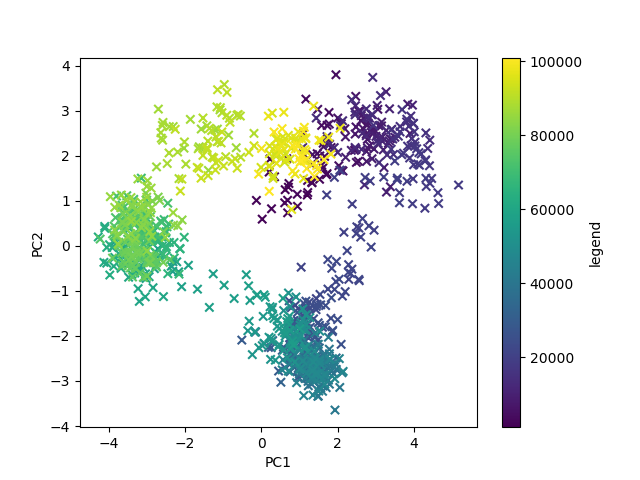
Principal Component Analysis on one of the systems in Hsp90
The final analysis is a process called Clustering Analysis. In this analysis, all three trajectories for each system are concatenated. Clustering Analysis uses gromos clustering algorithm in Gromacs, a package in molecular dynamics. It first counts the number of neighbors using cutoff and then takes the structure with largest number of neighbors, with all its neighbors as clusters, and eliminates it from the pool of clusters. Then to get the number of clusters at a specified cutoff, you have to run Gromacs which takes some time because you have to enter one cutoff value at a time for all the systems. Once I had gathered my data, I made a plot showing the number of clusters versus the RMSD cutoff.
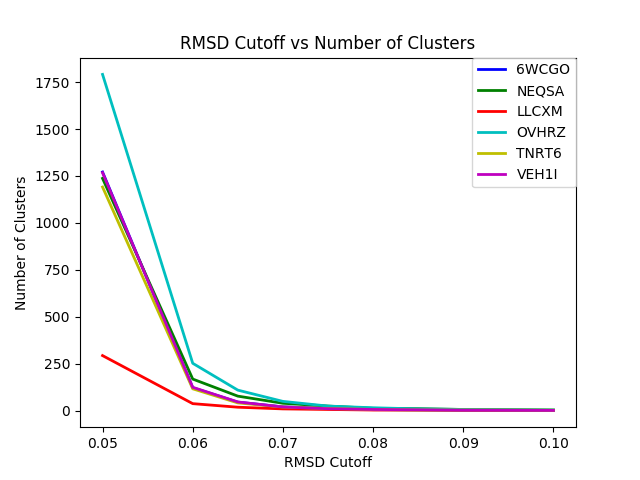
Graph of the RMSD Cutoff vs the Number of Clusters from each system
On Friday the lab took us on a tour of the San Diego Supercomputer Center. It was very fascinating to see the supercomputer center because it plays an important role in what we do in the lab.
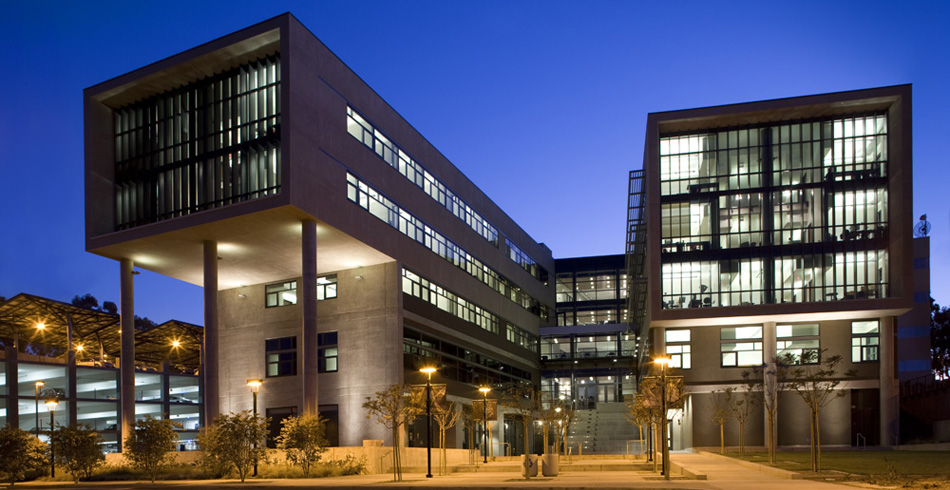
San Diego Supercomputer Center
This week outside the lab has been even more exciting as I was able to see new places. I went to the beach with Ty, Wynton, and Ry a couple times. On Friday afternoon, we went to a seafood restaurant in La Jolla and walked to the La Jolla Cove. There’s many seals and sea lions you can see up close.
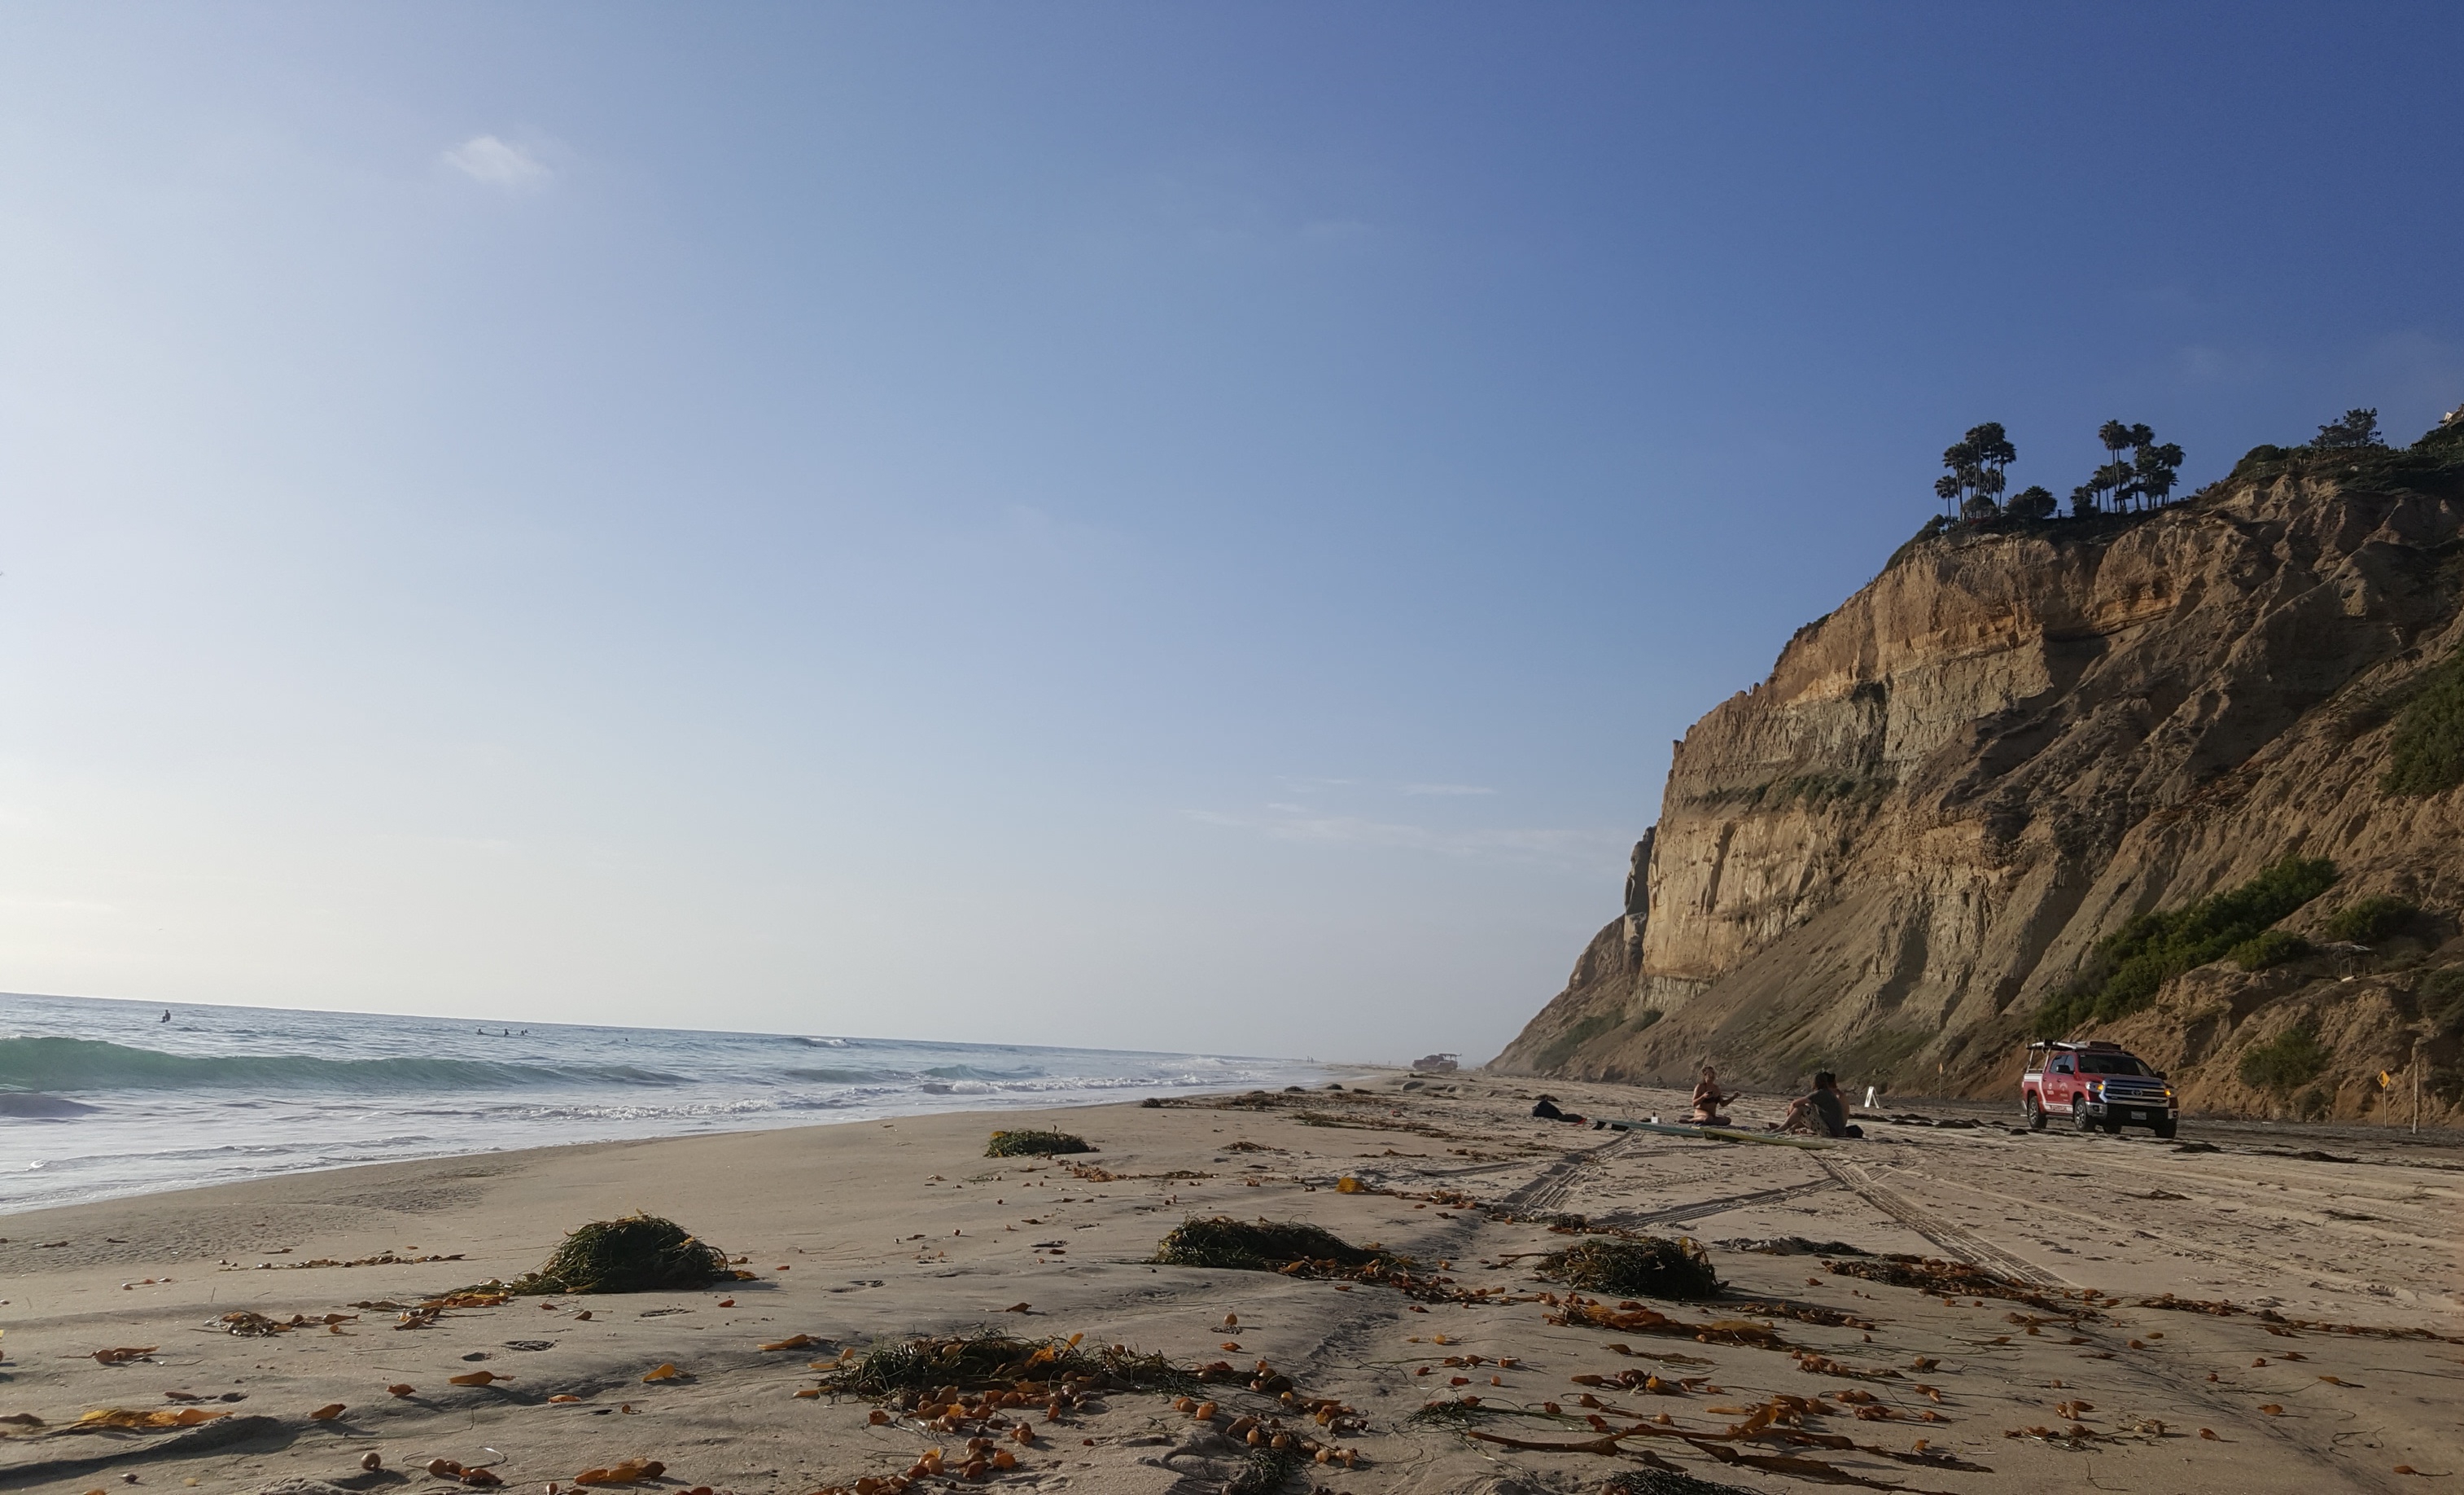
Blacks Beach
This week has been an exciting week both inside and outside the lab. I am excited for the weeks to come in the lab because we will finally be able to do research that may help the lab in the end. I cannot believe that I am almost half way through my internship. There’s still so much to learn and explore in San Diego.
There are no comments published yet.