
Working in research, particularly in human research, has turned out to be relatively unpredictable. Some weeks are jam-packed with participant after participant, and test after test. Others, however, are relatively mellow and generally lacking in scheduled research. This week at the lab qualified as one of the latter. Nevertheless, I still found it to be an exciting week.
Earlier in the week, I had the opportunity to sit in on a different study in the lab that was looking to assess the impact of exercise on breast cancer, and to see what psychological factors would enable participants to keep up their exercise regimens indefinitely. While this study lacked the use of sophisticated instruments, such as the fMRI, it was fascinating to learn more about the psychological side of neuroscience.
One of the highlights of this week, and of my entire internship, was the opportunity to work with Casey, a Grad student at the CUChange Lab. She introduced me to the statistical analysis that takes place after a study’s research is complete. During this time, we used a program called SPM to compare different sets of data from a past study that analyzed risky behavior of juvenile delinquents in Albuquerque, New Mexico. This study used a technique known as BART (Balloon Analog Risk Task) to record the impacts of risky behavior and the subsequent consequences (both negative and positive).
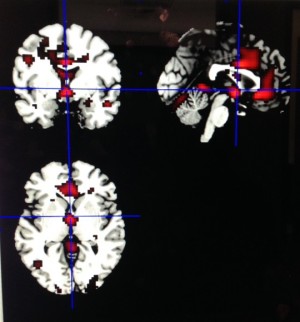
This fMRI image shows what parts of the brain were activated during the BART tasks
In this particular analysis, we divided the participants into two categories: those who participated in excessive amounts of certain high-risk teenage behavior, and others who had also participated, but not to the same extent as the first category. We were then looking for any significant differences between the groups, both statistically and cognitively (what parts of the brain ‘lit up’ during the fMRI scan). Although this particular data set did not reveal any significant findings, it showed me how extensive the data must be in these sorts of studies, both in the general statistics and in fMRI imaging.
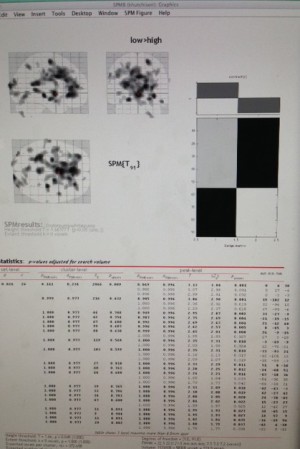
On the bottom of the photo, you see a small sample of the data from this particular study. On the top-right of the image, there is a graph indicating what two sets of data were being analyzed (low>high). The three images of the brain in the top-left show what parts of the brain experienced cognitive activity during this task.
There are no comments published yet.