
This week’s focus was on coding, so my research group could be prepared for Noah’s academic conference presentation. I had been given 4 sets of data to code, 3 into pie charts, and the remainder into a bar graph.
Monday: I had no meetings scheduled for this day, so it was more of a “do it myself” day. I messed around with Codecademy Pro and my coding software, Thonny. I got side tracked and started watching various Ted Talks. Some were about love, others were about education.
Tuesday: Today we had our normal schedule of meetings. We checked in with Noah at 10 am. As a group, we went over how our coding has been treating us. I mentioned that I now have Codecademy Pro, so I’ve been practicing data visualization. One of the things I’ve been having problems with is including percentages into the charts (pie charts). I was able to leave the meeting early, because Noah and Indie had to work out their own code they have been working on. In our whole group meetings we had to take a test prior to that. The test was called the Clance Impostor Phenomenon Test. The Imposter Phenomenon “is a psychological pattern in which one doubts one’s accomplishments and has a persistent internalized fear of being exposed as a “fraud”.” My score was a 69, which is considered “Significant Imposterism”. Below is how you are scored, and the link to the test.
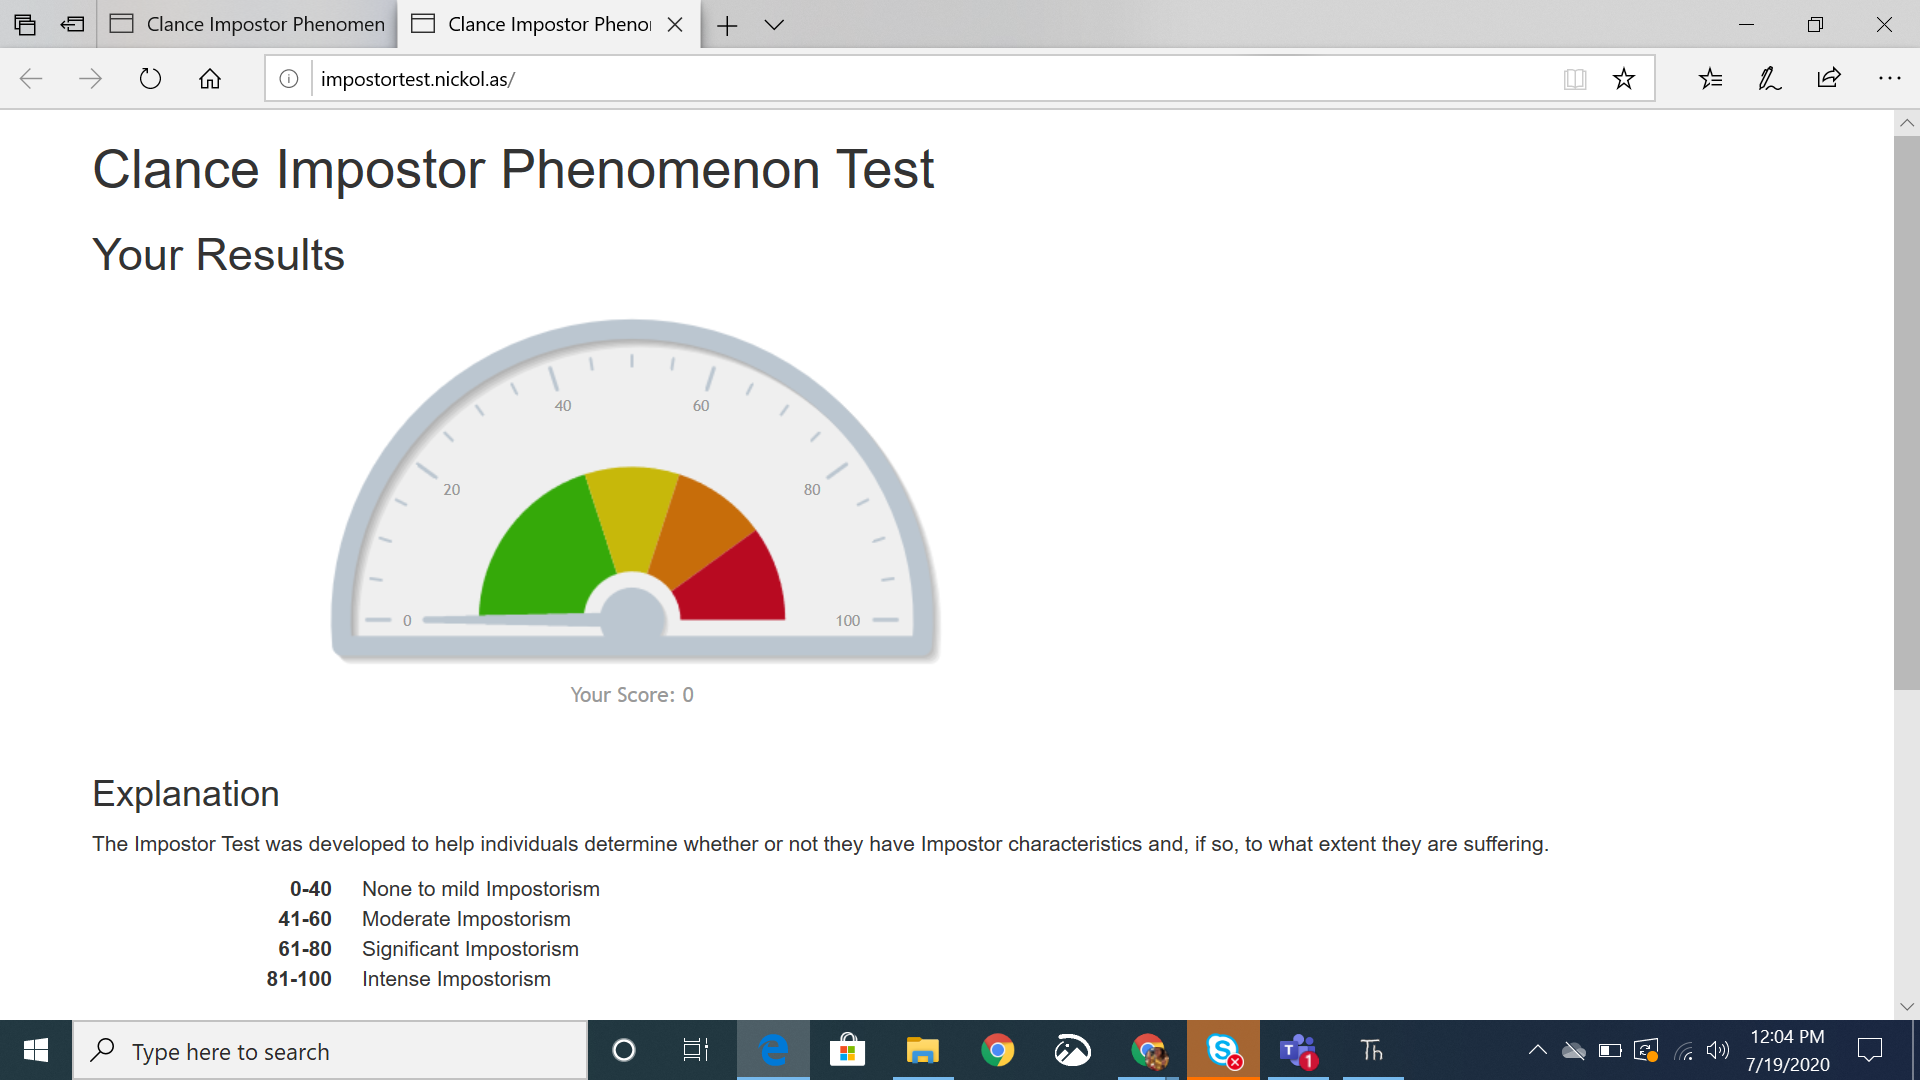
http://impostortest.nickol.as/
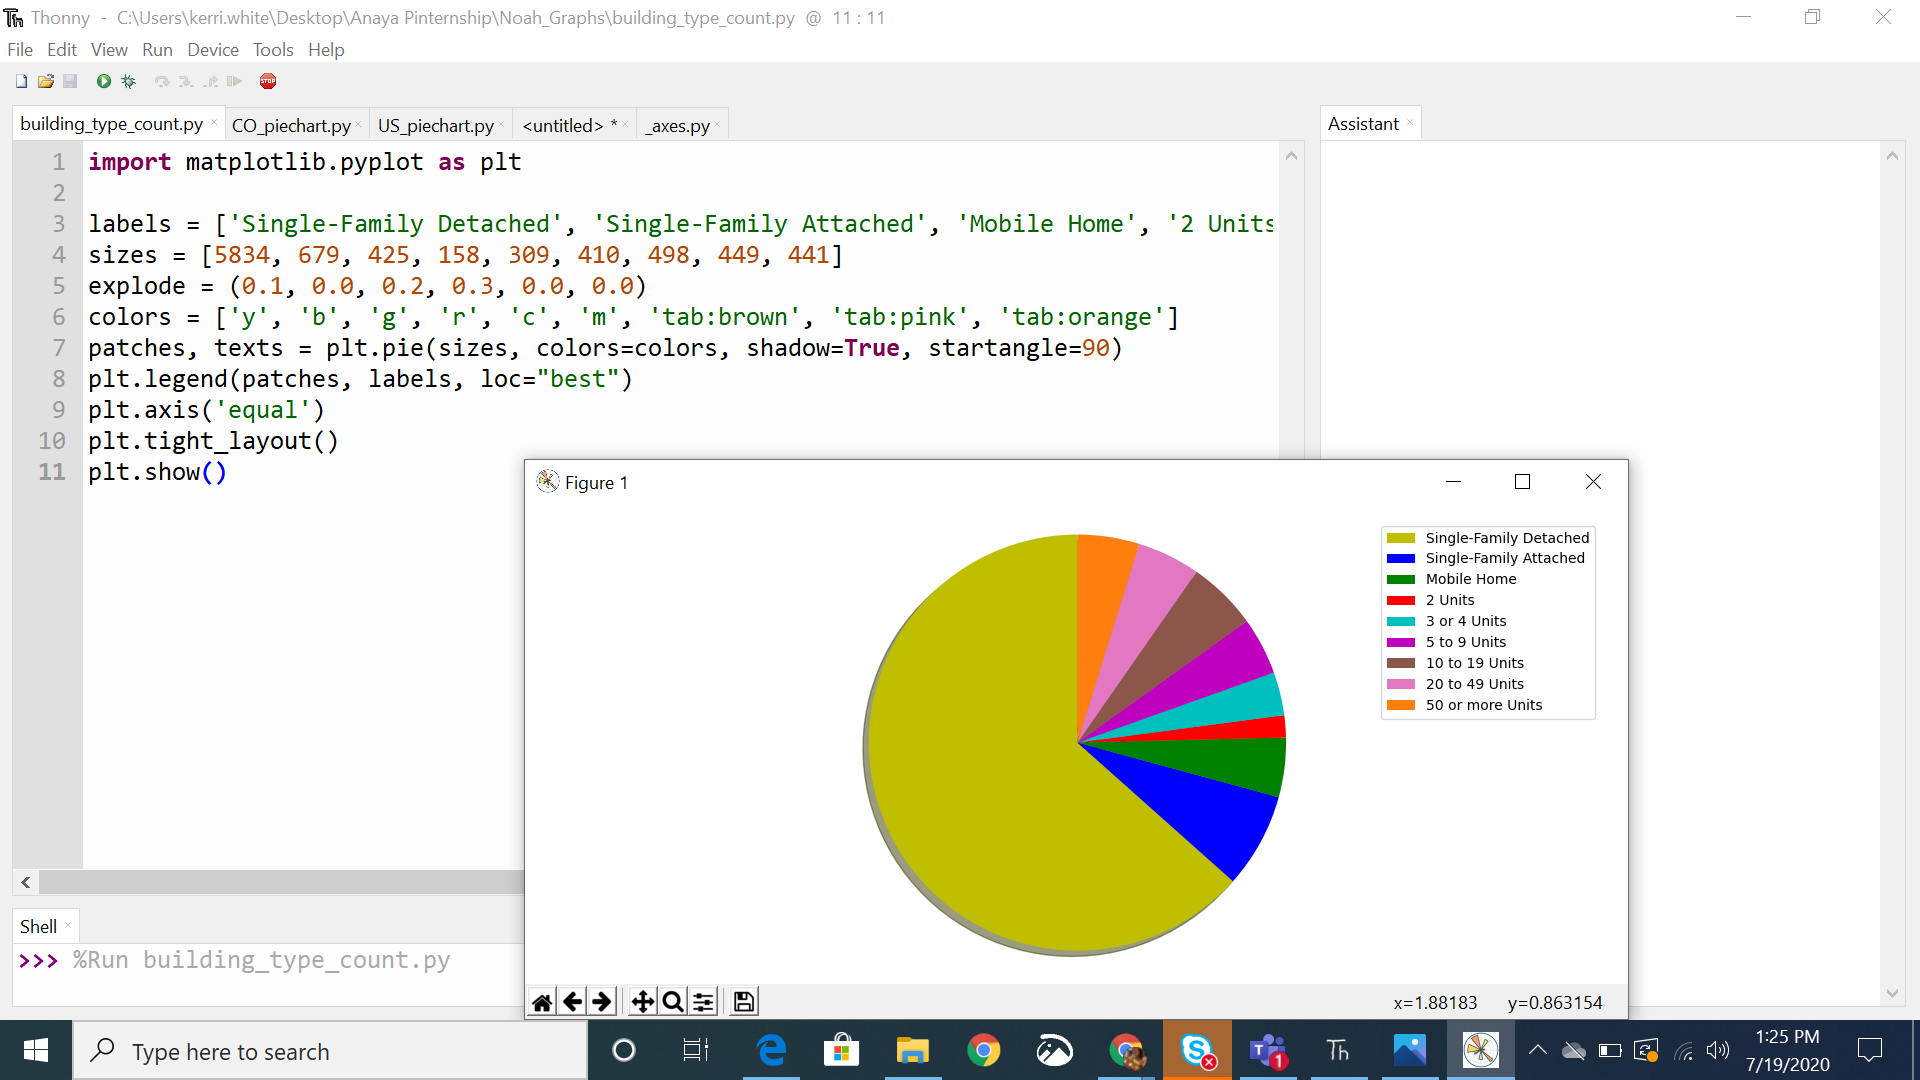
Wednesday: Noah gave me some data to turn into a pie chart. The data I had to code was the number of Colorado Building types. This was one of my first pie charts to ever code. It was relatively simple, almost like a bar graph. The only issue I ran into was being able to add percentages into the pie chart.
Thursday: We had a check in with our mentors on Thursday. I told Noah about my issues with adding percentages, and he sent a few links to help me out. I came to the conclusion that I had to restart my own code. Which is rough, because I had gotten so used to my code. Noah had also sent me more data to turn into graphs, so the graphs could be prepared for his presentation for his conference next Friday. I also found out that I will be apart of the presentation, which is nerve-racking, but also very exciting.
Friday: My only assignment this day was to watch the documentary “13th”. Lucky me, I had already watched the documentary 3 times. The documentary explains and explores the history of racial injustice in America. It focuses on the prison system, and how it is disproportionately filled with African-Americans. I would recommend this documentary to everyone, it’s very educational and eye-opening. So, I spent the day in Telluride, helping set up the bags for the “Science of Cocktails” function on Saturday.
There are no comments published yet.