
This week in lab, the fun had began as we started to do research for the lab. The first half of my internship, I had been learning the fundamentals and different analysis methods used to analyze proteins. Our task now was to find new methods to predict the rank order of the ligands by their IC50 value. We were given 6 of the IC50 values out of the 12. In order to predict the rank order, we had to come up with new methods to see if there was any correlation between the 6 IC50 value of the ligands compared to the analysis we chose to do. For example, after running a analysis, it outputs data and then we can use that data and plot it against the IC50 values of the ligands to see if there’s any correlation. Once you find some correlation, it will help predict the rank order of the 12 ligands by comparing the 6 we know with the 6 we don’t know.
One of the methods my group came up with is called MM-PBSA, short for Molecular Mechanics Poisson Boltzmann Surface Area. This analysis basically computes the approximate binding free energy of a ligand to a protein. Free energy is the amount of internal energy of a thermodynamic system that is available to perform work. It is also expressed as Gibbs free energy, which is a thermodynamic quantity equal to the enthalpy of a system, minus the entropy and absolute temperature. After running the MM-PBSA analysis, it outputs a file that contains many different calculations but we are only focusing on one number, which is the binding affinity. The binding affinity is the strength of the binding interaction between the protein and the ligand. Our hypothesis was that the higher the IC50 value, the higher the binding affinity. We believed that there would definitely be a correlation between the binding affinity of the system and the IC50 value, but there was no correlation at all.
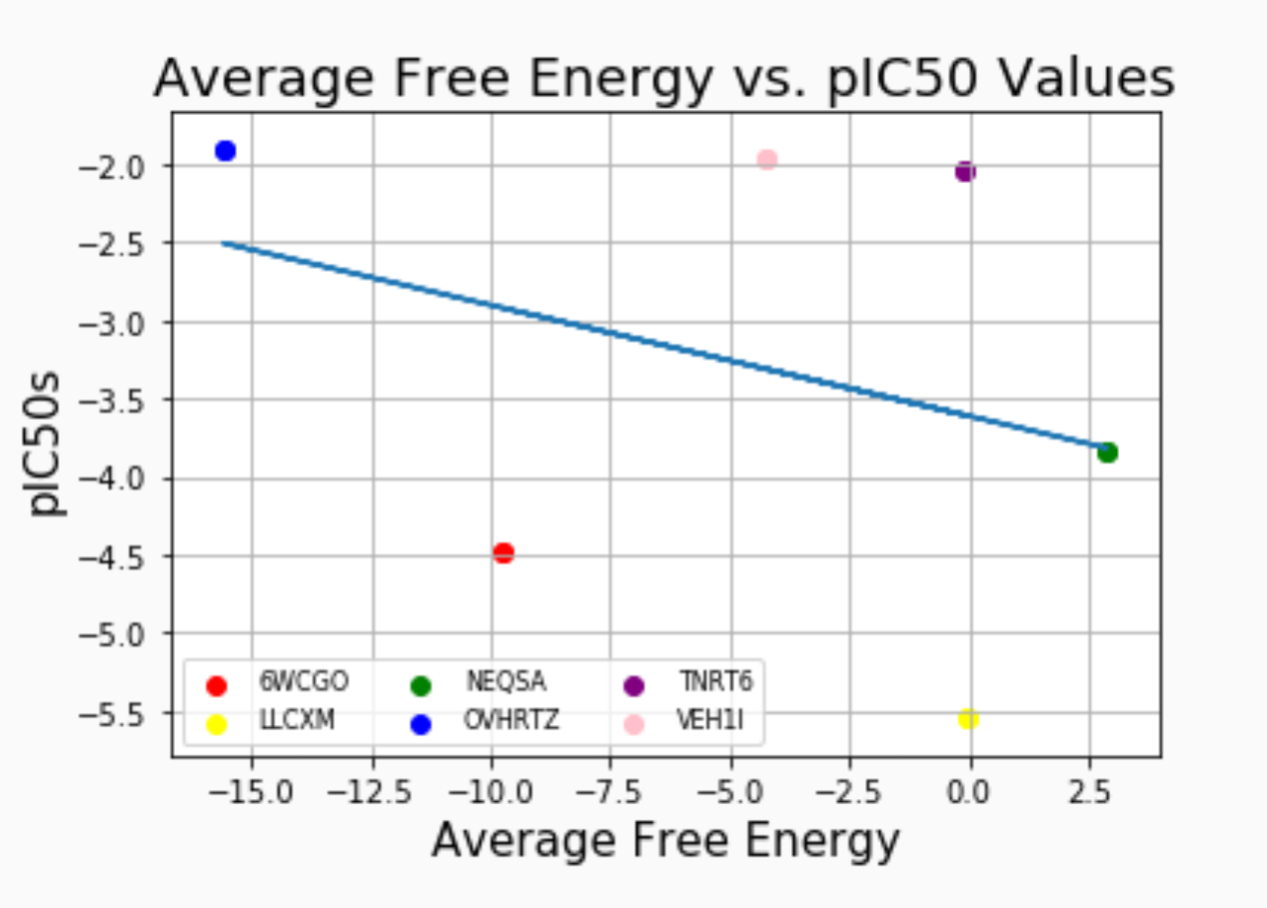
Figure for MM-PBSA analysis
While we worked on the MM-PBSA analysis, our other group member was working with two other analyses. They were called the Radius of Gyration and DSSP (Secondary Structure). The Radius of Gyration calculates the compactness of a structure. This is calculated by taking the root mean square distance from either the center of mass or given axis. Unfortunately, there was no correlation from this calculation. For DSSP, this analysis uses the secondary structure of the protein and categorizes the protein into eight types of secondary structure, depending on which they fall into. These analysis was quite complicated and we weren’t able to analyze the data completely as we ran out of time this week. Next week we will focus on finishing the DSSP analysis and find at least one more analysis method we could use.
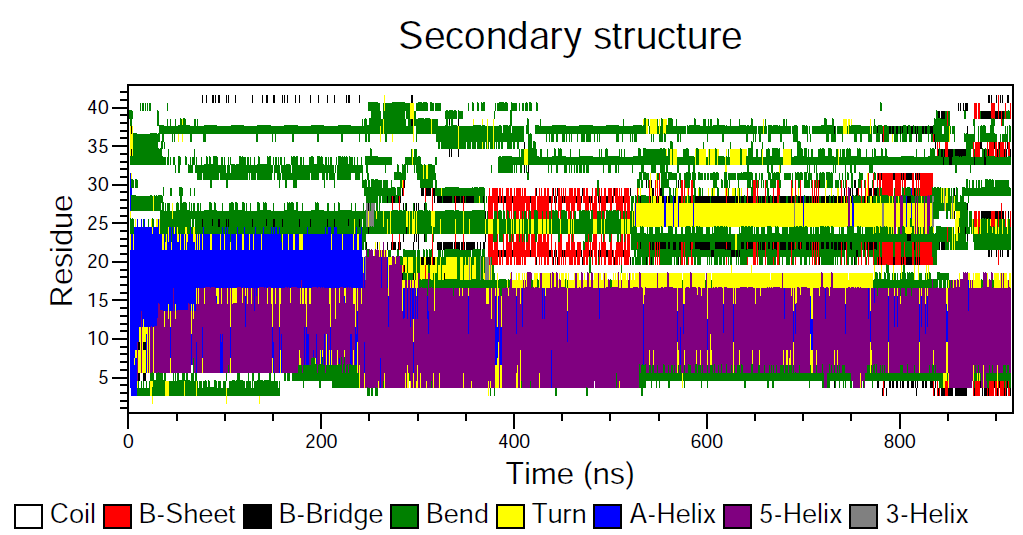
This is an example of a figure from the DSSP analysis
After lunch on Thursday, we went to see the Fallen Star, a piece of art that is located on campus. The Fallen Star is a house that is on the edge of Jacobs Hall at an angle. This sculpture was built by Do Ho Suh, a South Korean artist. Also, it is part of the Stuart Collection, which is public art on campus.

Fallen Star
As for this week outside the lab, I spent most of my time relaxing at my dorm and walked down to the beach a couple times as well. Also, it was Wynton and Ry’s last week here, so I met up with them and Ty one afternoon and we all had some delicious pasta for dinner.

La Jolla Shores
There are no comments published yet.